
Every now and then we will want do display our data on a map rather than on a graph, so let's look at how we can use MapBox from within Jupyter.
for python users, the first thing we need to do is install the mapboxgl python module: pip install mapboxgl
#set up our imports
import pandas as pd
from mapboxgl.utils import *
from mapboxgl.viz import *
#load some data into a dataframe
df = pd.read_json('markers.json')

#let's look at the dataframe head
df.head()
| lat | lng | id |
|---|---|---|
| 34.019674 | -118.391161 | 234277 |
| 34.090732 | -118.324428 | 235167 |
| 34.101677 | -118.325844 | 235168 |
| 34.174494 | -118.326895 | 235169 |
| 34.084512 | -118.133240 | 236018 |
We've successfully loaded our markers into the dataframe. Its the columns lat & lng that we are interested in for plotting on the map, but there's more preparation we need to do..
Mapbox
First you'll need to register an account with Mapbox, and from there we need to generate a token to be able to communicate with the mapbox server:
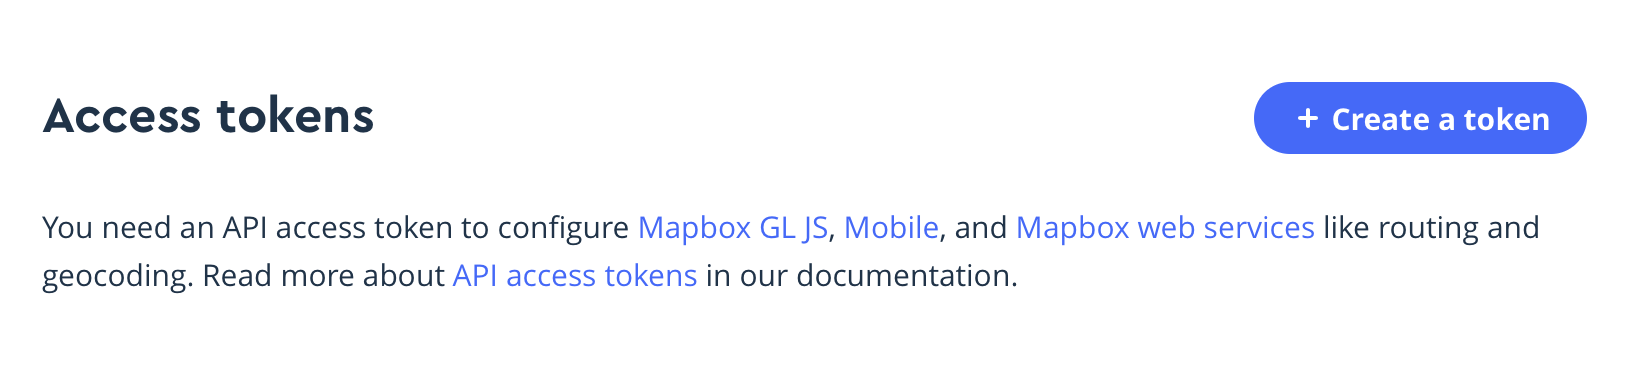
Once we have our token, we can begin. Remember, your token is private so think twice before uploading your notebook to anywhere public e.g Github.
The first step is to convert our dataframe into geojson, a format similar to json - but understood by most modern mapping systems
#save the dataframe to markers.geojson
#specify what column is our lat, and what out long
df_to_geojson(df,
filename='markers.geojson',
lat='lat', lon='lng', precision=3)
#establish the token
token = "XXXXXXXXXXXXXXXXXXXX"
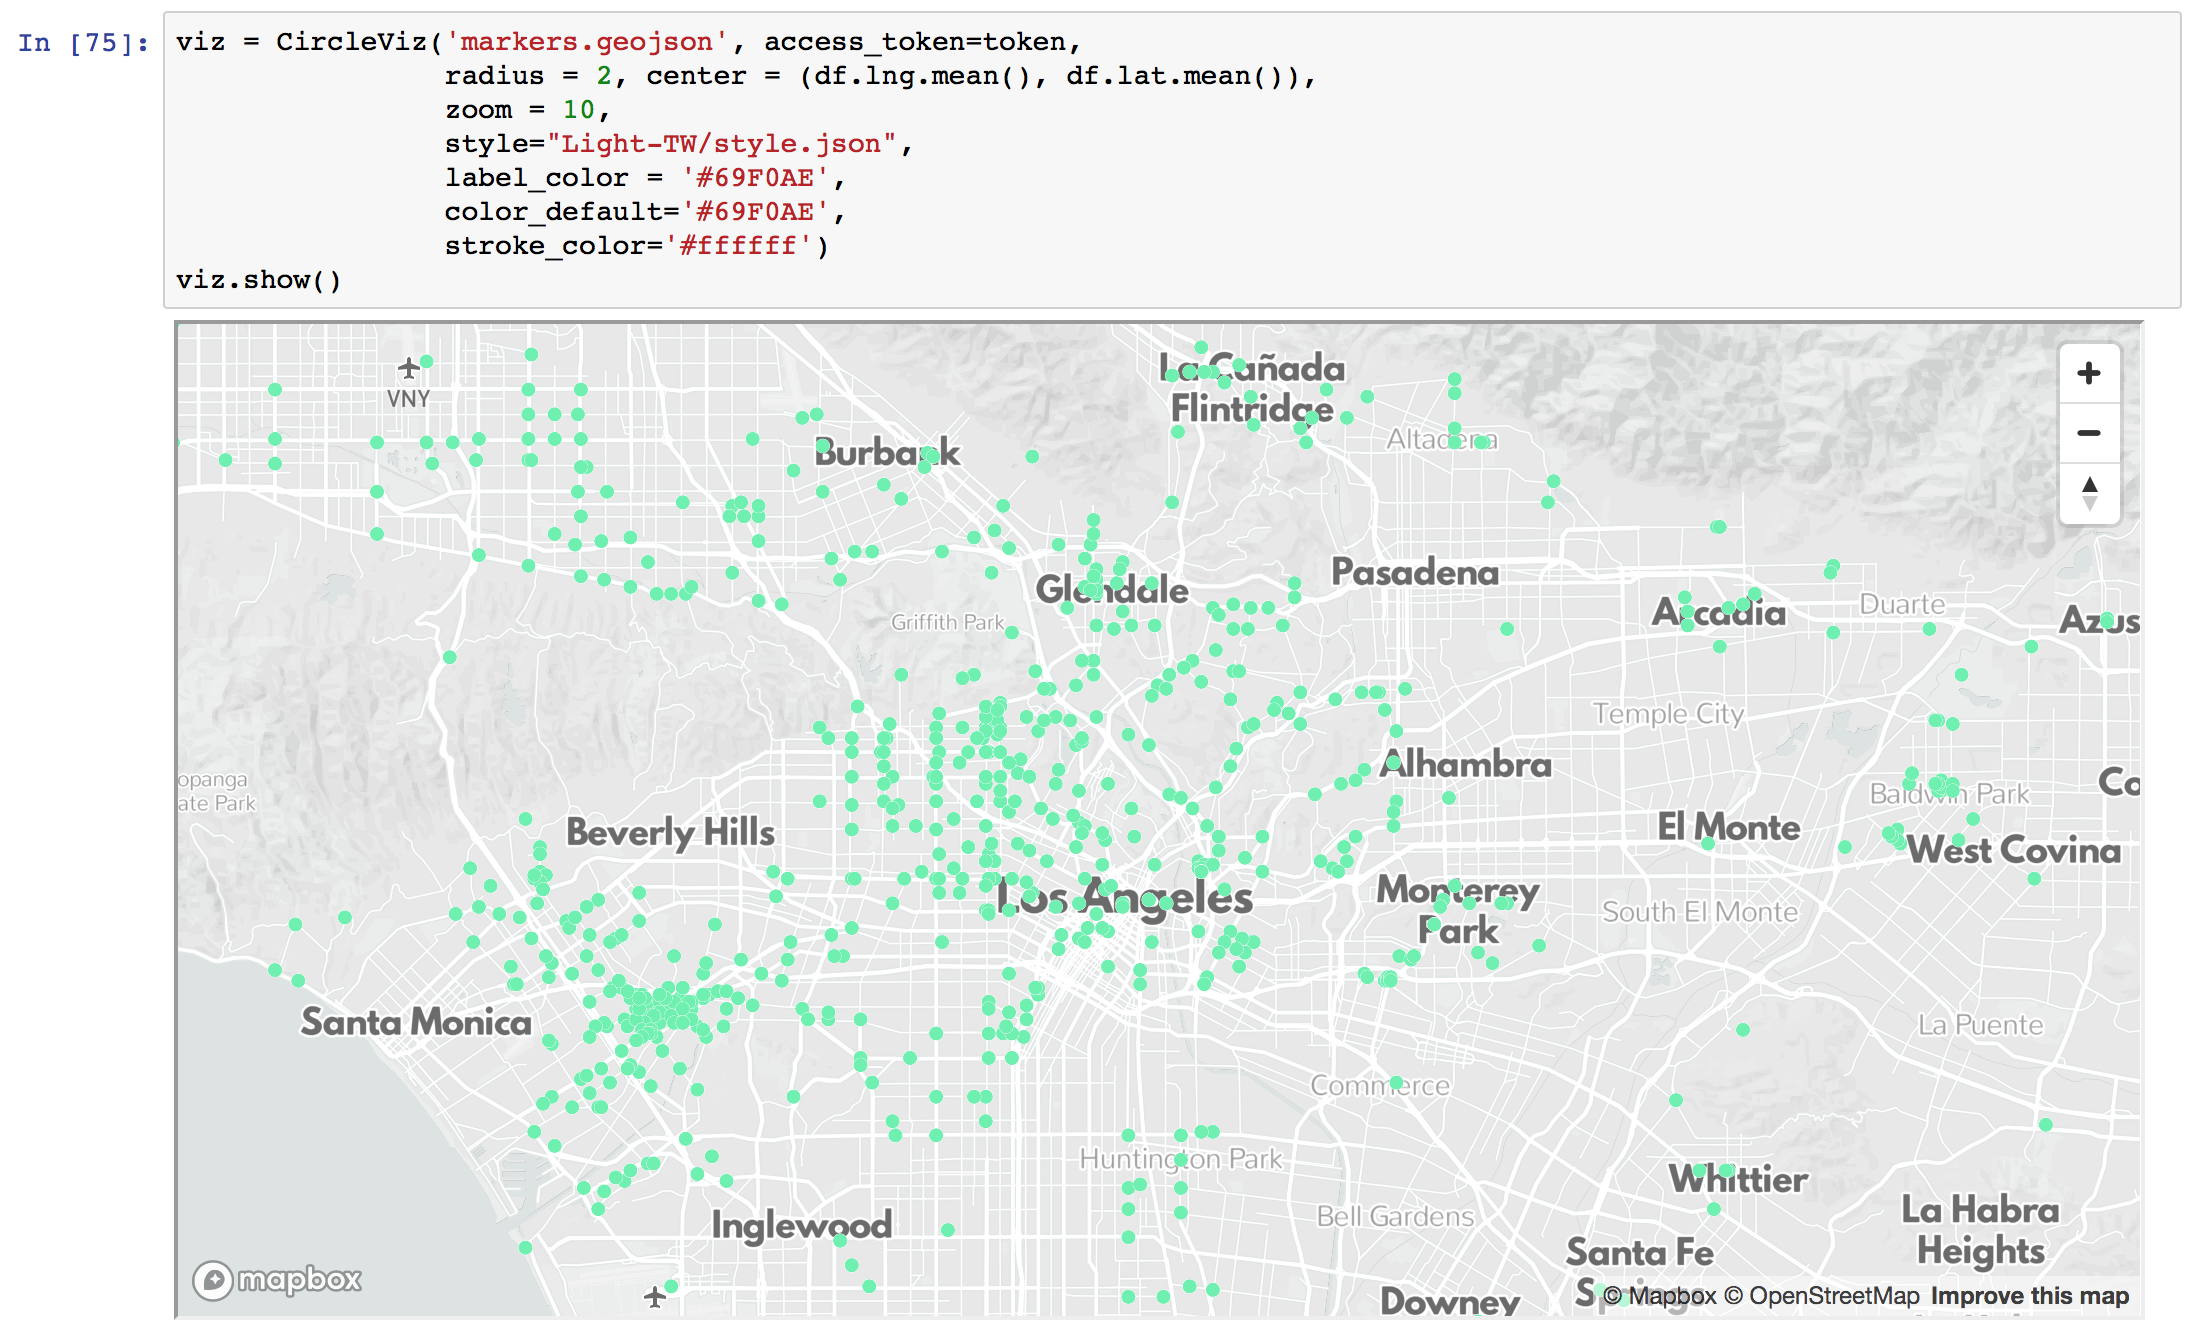
#now to use the geojson to generate the map
viz = CircleViz('markers.geojson', access_token=token,
radius = 2, center = (df.lng.mean(), df.lat.mean()),
zoom = 12,
style="Light-TW/style.json",
label_color = '#69F0AE',
color_default='#69F0AE',
stroke_color='#ffffff')
viz.show()
and as if by magic, the map is shown in the next cell in our notebook:
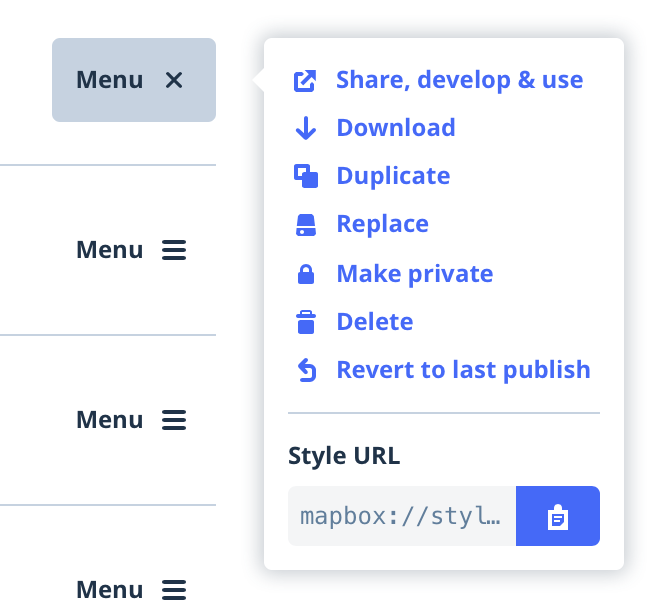
Styling
you'll notice that I specified a style argument in the CircleViz finction. This is a really cool feature of mapbox - you can generate your own style from within your mapbox account Mapbox Studio. There's so many things you can do to edit your maps that I won't get into them here. Once you have set up a style you are happy with (or leave the argument out altogether for the default) you can either access it from the url that mapbox give your style, or you can download the files for local use.
You can find a lot more info here for further customising, and different type of map marker visualisation. Hopefully this will set you on the course for producing some really sweet maps.
Comments